
An example, in pictures
What your Gantt chart looks like
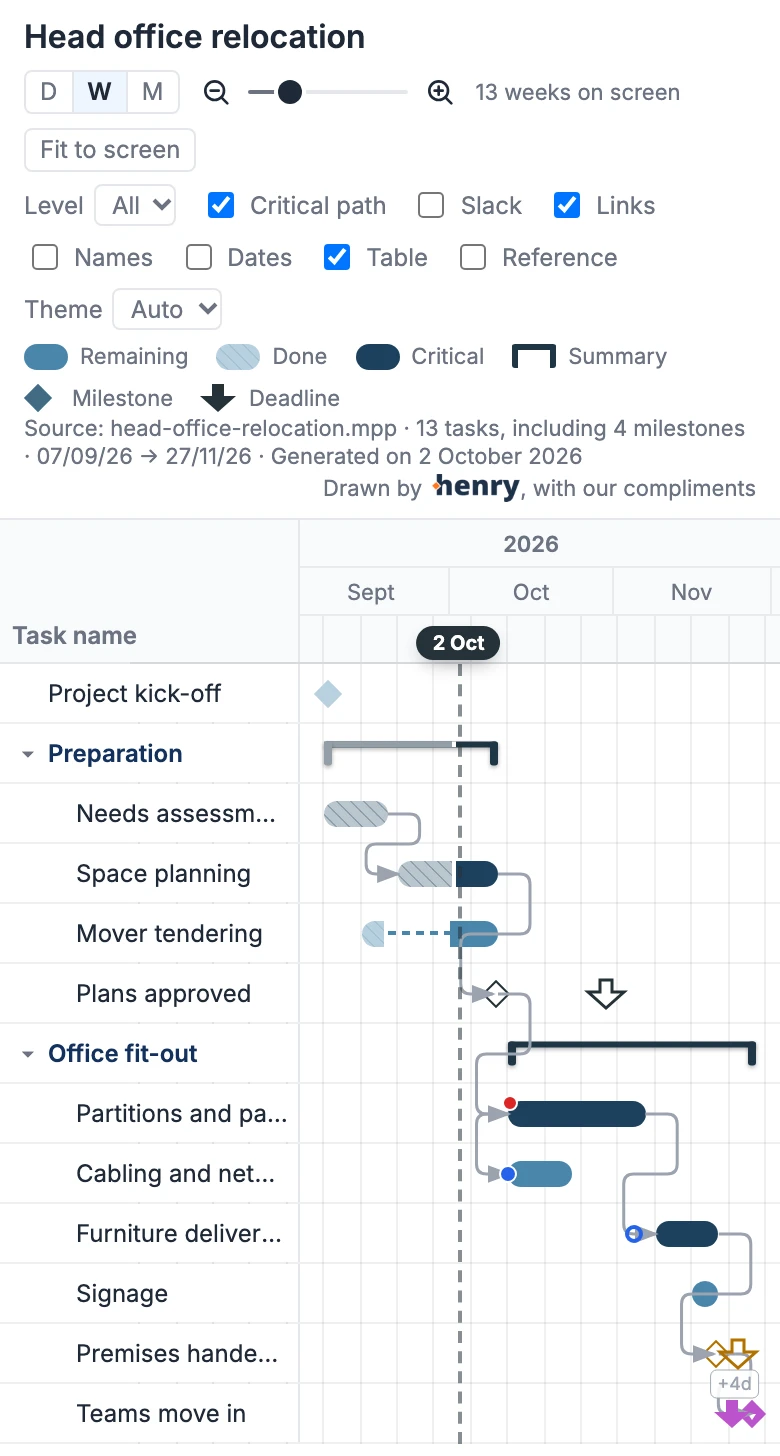
This is what Henry makes of an .mpp file: the fictitious schedule of a head office relocation, as it appears in the file you get. Each picture below then isolates one element of the drawing and explains how to read it.
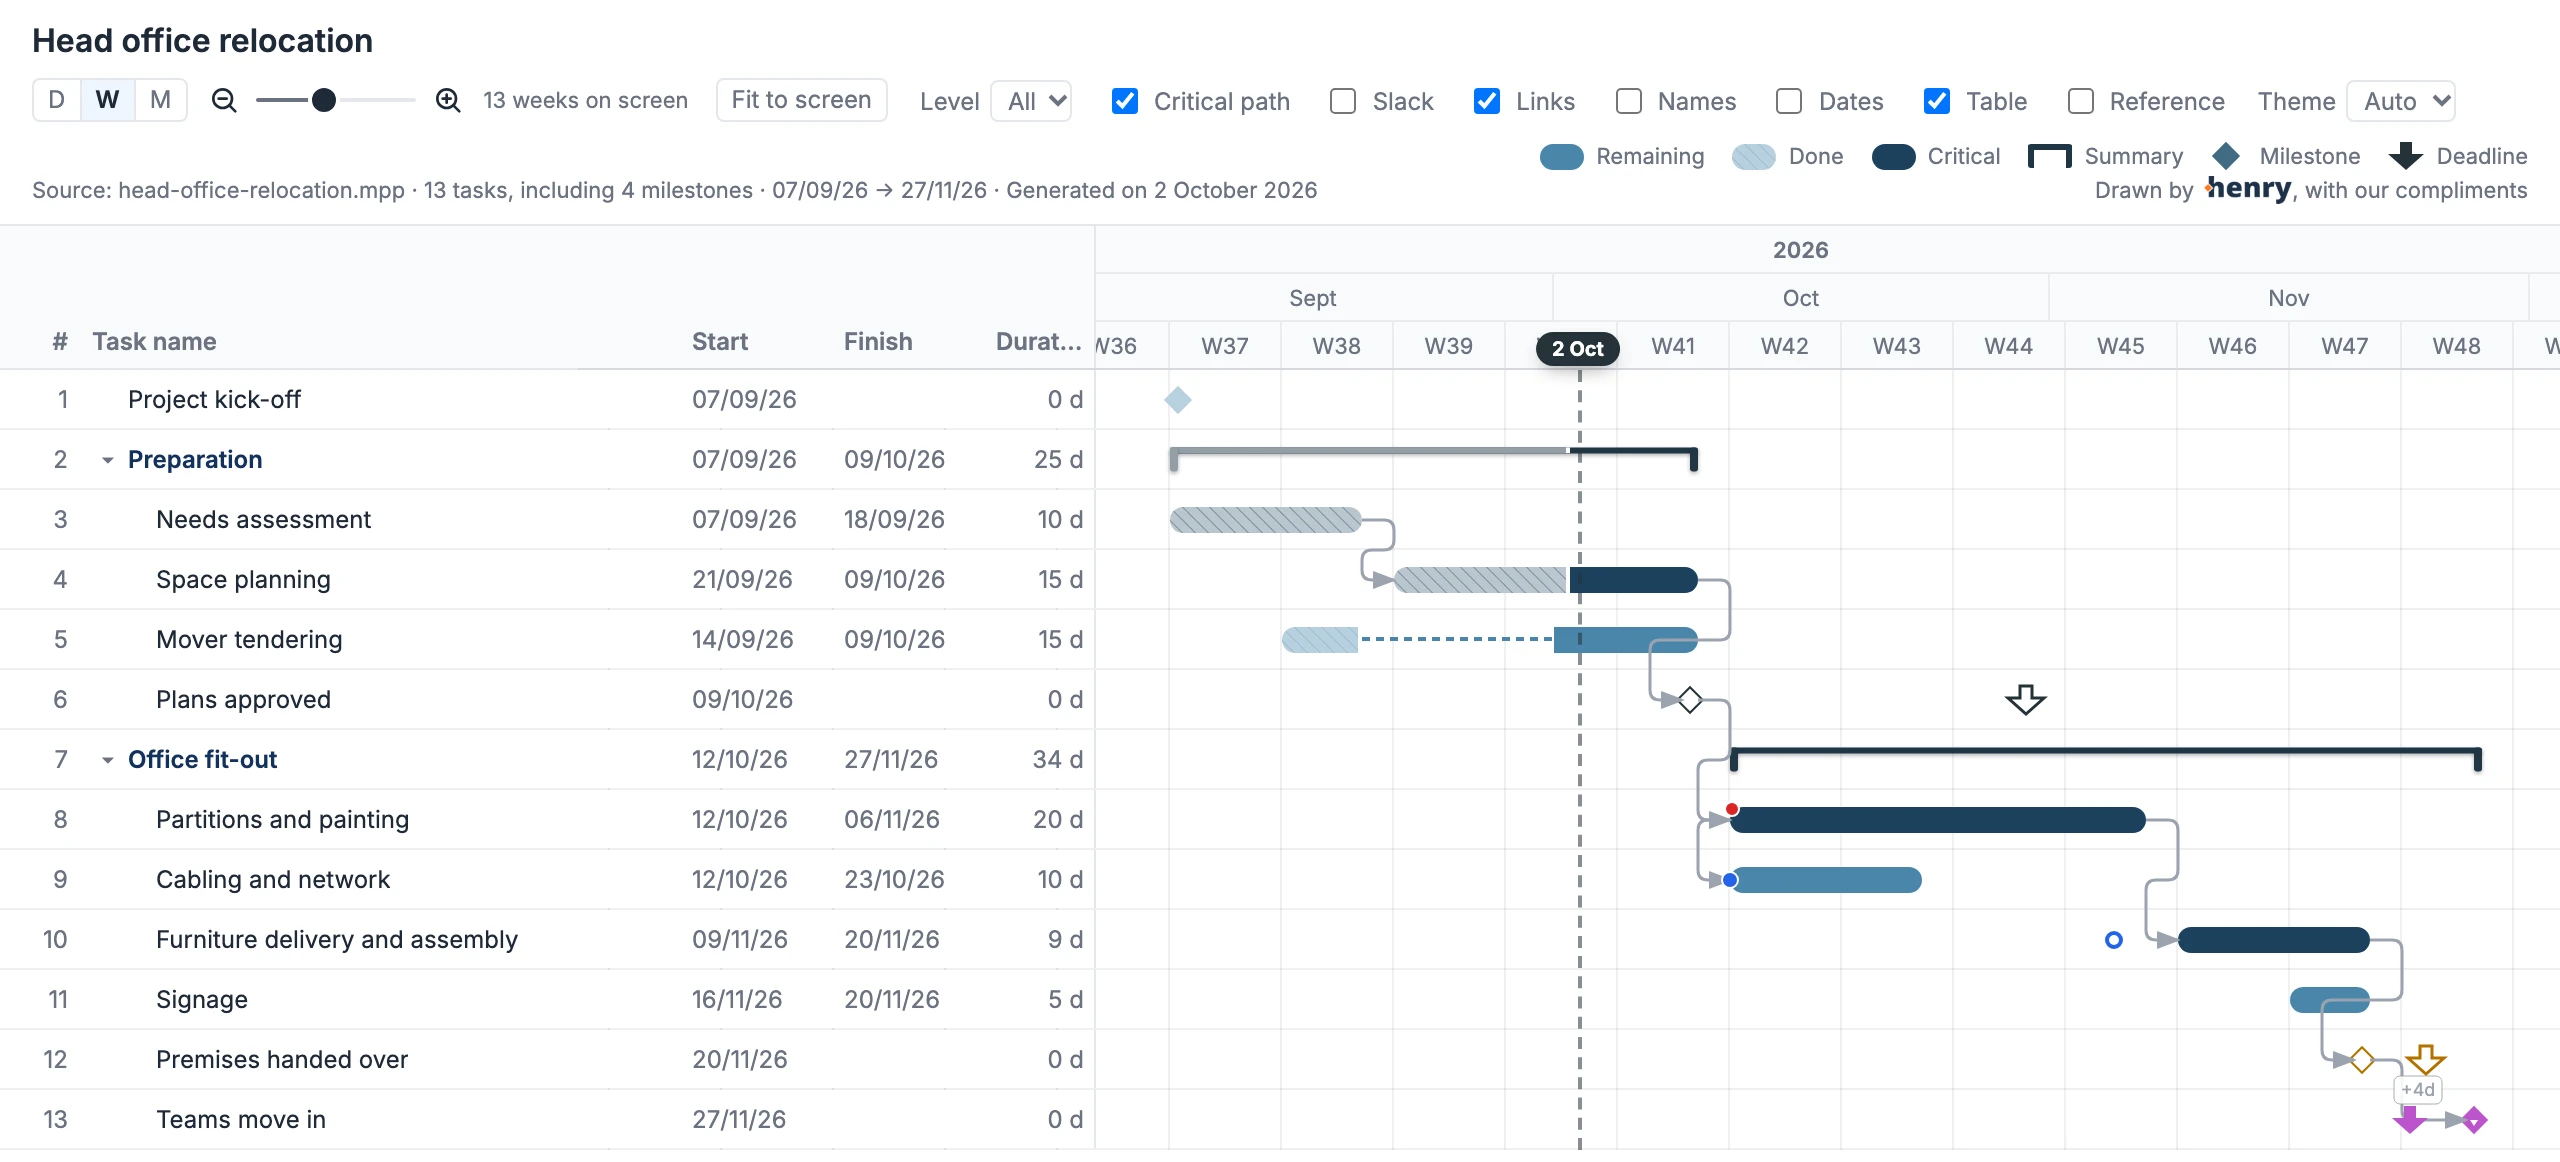
The table and the bars
The table follows MS Project's columns: number, task name, start, finish, duration in working days. Summary tasks are in bold; clicking their triangle collapses or expands their tasks.
In the Gantt chart, each task is a bar placed at its dates. The legend, top right, gives the grammar:
- Blue: what remains to be done.
- Hatched: what is done.
- Navy: a task on the critical path.
- A bracket: a summary task, spanning all its tasks.
- A diamond: a milestone. A downward arrow: a deadline.
Actual progress
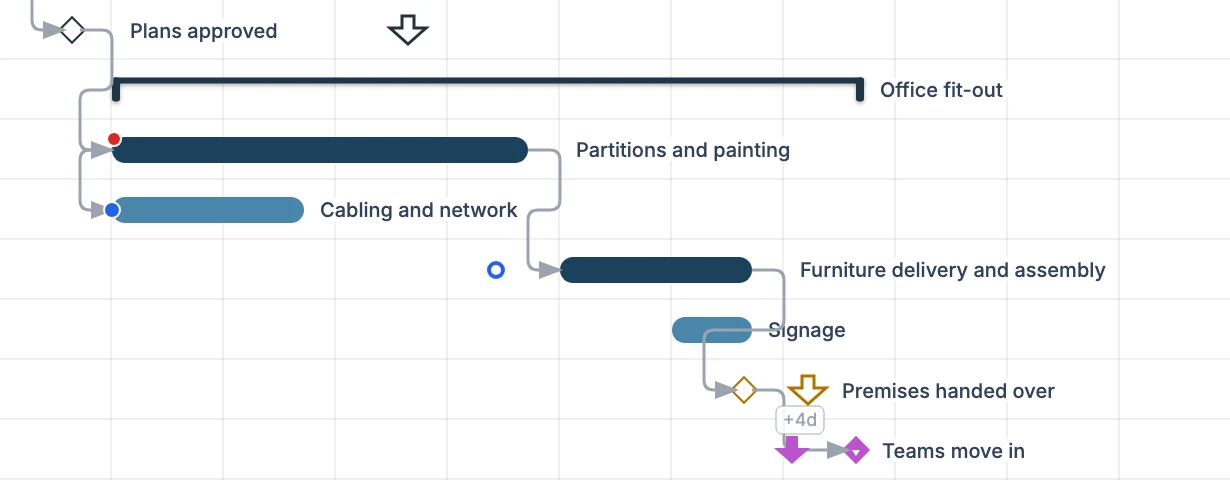
The dotted vertical line is the day the schedule is looked at, its date in a bubble: here, 2 October. Everything hatched to its left is done.
- A finished task is hatched end to end: the needs assessment.
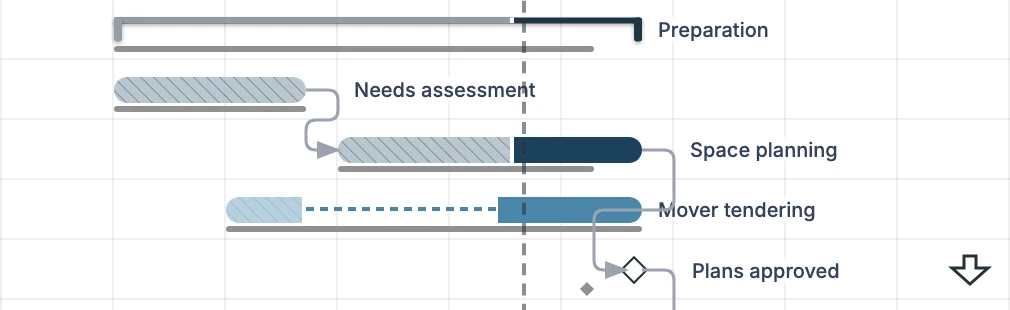
- A task in progress is hatched up to its progress, then solid for what remains: space planning is half done.
- An interrupted task shows its pause as a dotted line: mover tendering stopped after its first week and resumed on 1 October.
- A summary task's bracket fills in the same way, grey for what is done.
- A milestone reached turns pale: the project kick-off.
Critical path, links and slack
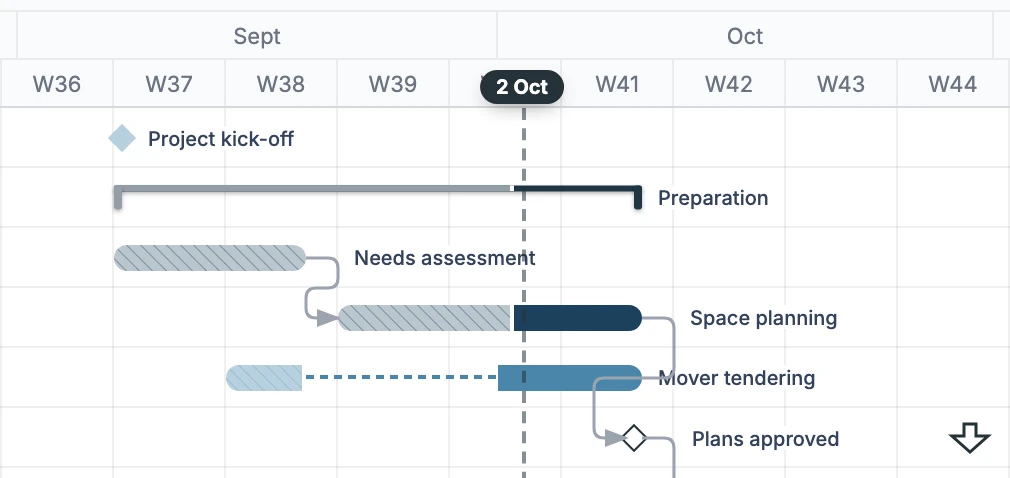
Critical tasks are those whose slightest delay pushes back the end of the project. They are navy; the “Critical path” box highlights them or returns them to the common colour.
- The grey arrows are the links between tasks. Cabling starts at the same time as the partitions: a start-to-start link.
- With the “Slack” box, a green line extends a task that can slip without delaying anything: light green as long as it does not push back the next task (free slack), dark green until it would push back the end of the project (total slack).
- A red line before a bar shows negative slack: the task is already late against what is expected of it. That is the case for the furniture.
- The dots show date constraints set in the file: blue for “start no earlier than”, red for “as late as possible”.
Milestones and deadlines
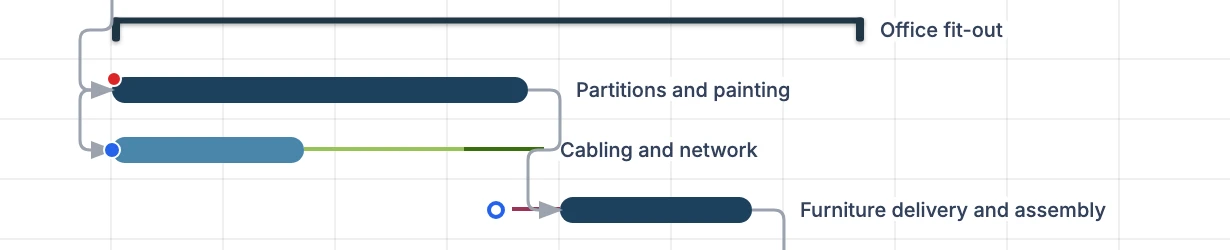
A milestone is a diamond. When the file gives it a deadline, a downward arrow places it on the calendar, and its colour tells whether it holds:
- Outlined in black, far from the milestone: the deadline holds, with room to spare. Plans are approved on 9 October for a deadline on the 30th.
- Orange: the deadline holds by a narrow margin, less than five working days. The premises are handed over on 20 November for a deadline on the 24th.
- Solid purple: the deadline is missed, the milestone falls after it. The move-in is planned for 27 November; it was expected on the 23rd.
- A label on a link shows a lag: the move-in waits four days after the premises are handed over.
The baseline
When the file keeps a baseline (the schedule as it was originally agreed), the “Reference” box shows it as a grey line under each bar. A bar that runs past its line has slipped.
A line above the chart sums it up: “Compared to the file's baseline · 3 slipping · 1 ahead · 1 new · Project finish +3 d”. Space planning finishes three days after its baseline; the small grey diamond under the plans approved marks the milestone's original date.
View tools
Everything is adjusted inside the file, with no connection: the scale (days, weeks, months), the zoom and the “Fit to screen” button that fits the whole project on screen, the level of detail, and boxes for the critical path, slack, links, names on the bars, dates, the table and the baseline. The theme follows the computer's, or can be set to light or dark.
On a phone
The same file opens on a phone. The table narrows to the task names, the chart scrolls with a finger and the tools wrap onto several lines.
The file you get
- A single HTML file that opens in any browser, on Mac or PC, on a tablet or a phone.
- No Microsoft Project, no account, no software to install. It even works offline and loads nothing from outside.
- It is passed on like a document: by email, or in a shared folder.
- It is read-only: the schedule can be viewed, not edited.
- Its colours follow the palette chosen when you get it.
See yours.
Drop your .mpp file: the preview appears in a few seconds, and the full schedule is free.
Open an .mpp file